Debugger is an essential tool for finding bugs in software. There are plenty of great Linux debuggers that make it easier for developers to find weak points in software.
In this article, we will send you a list of the 10 best Linux debugger tools. Invite you to consult.
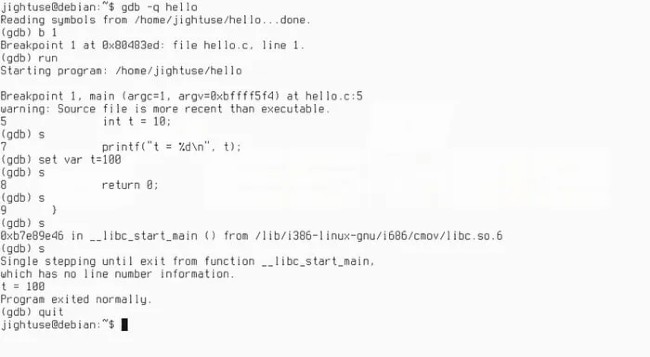
1. GNU Debugger (GDB)
GNU Debugger (GDB) is one of the best Linux debuggers out there. It is a powerful tool with a ton of features. GDB support for many popular programming languages, including C, C ++, Fortran and Java. It can also run on multiple CPU architectures such as x86, x86-64, ARM, PowerPC, SPARC and MIPS.
2. LLDB
The LLDB is part of the LLVM project. This tool is becoming more and more popular thanks to its superiority and efficient workflow. It also becomes the default debugger in Xcode for macOS and Android Studio. Some of the notable features of LLDB include support for multiple built-in compilers, a language-independent system, and remote debugging.
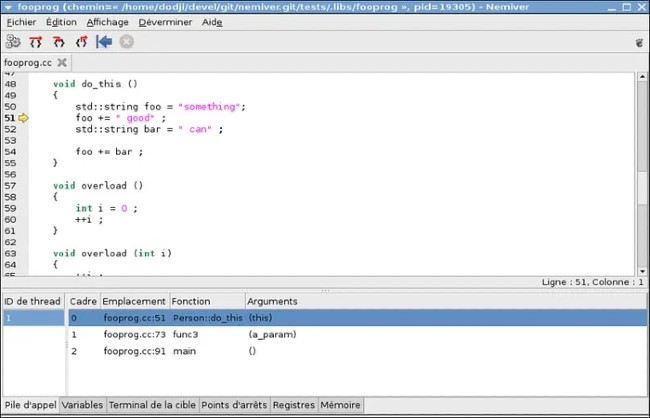
3. Nemiver
Nemiver is a feature-rich debugger written in C ++. It provides users with an intuitive, easy-to-observe interface. Nemiver also integrates easily with GNOME-based desktop environments. However, this is not a standalone Linux debugger. It uses GDB as the back-up and provides a graphical GUI to manage the debugging process.
4. Interactive Disassembler (IDA)
Interactive Disassembler (IDA) is a powerful tool for analyzing binary files and programs. This is an exclusive solution for professionals and offers a variety of advanced techniques.
The IDA Pro Edition can even provide an interactive, extensible, and highly programmable debugger. Therefore, it can be used for forensic analysis and automatic validation. You can also use the free version but only have a few features.
5. Delve
Delve is a simple but feature-rich Linux debugger for Google’s Go programming language. You can use it to interact with your programs at runtime and manipulate things like goroutines and stacks. Delve itself is also written in Go, so it can provide high-speed runtime for programmers.
6. Xdebug
Xdebug is a powerful PHP debugger for Linux. It provides an easy-to-use debugger that can be used with multiple IDEs. Xdebug can be installed easily on a Linux computer using the package manager.
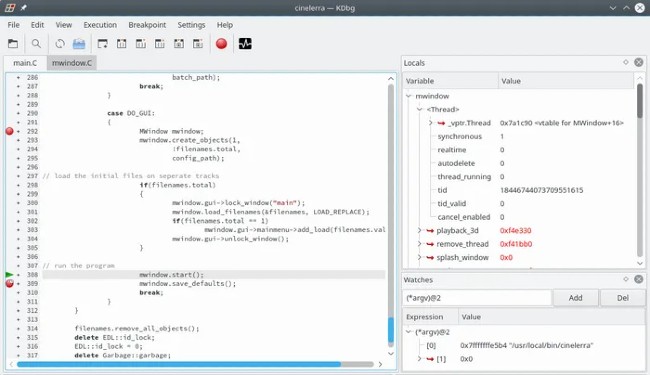
7. KDbg
KDbg is a graphical interface debugger for the KDE desktop environment. KDbg is, in fact, just a GNU Debugger interface. Using KDbg you get all the features of GDB along with an intuitive user interface. Therefore, KDbg is suitable for those who are just starting to learn debugger.
8. Valgrind
Valgrind is a highly efficient debugger that provides a lot of additional tools for software analysis. It runs on all major platforms including Linux and Mac.
Furthermore, you can use it as a framework and create more flexible analysis tools. Overall, Valgrind is a perfect choice for professionals.
9. BASH Debugger
BASH Debugger or bashdb is a simple but useful Linux Debugger. You can use it to analyze bash scipts during execution. This is a great tool for Linux administrators who frequently have to use scripts bash on their computers.
10. strace
strace is a usersapace utility for Unix. It allows users to monitor system commands and signals directly from the terminal. Programmers can use strace to dump stack trace, filter system commands, modify return code, extract file descriptor …
Having powerful Linux debuggers at hand is a lot easier as a developer. Almost any software engineer has to install tools like GDB and LLDB. On the other hand, specialized debuggers like Delve and Xdebug will be reserved for specific projects and ecosystems.
Source link: 10 of the best Linux debugger tools for software engineers
– https://techtipsnreview.com/