People tend to use computers longer than their other technology devices such as phones, tablets, etc. Therefore, it is advisable to regularly monitor and capture the operating status of the device. Today’s Chromebook models come with an app called “Diagnostic” built-in, which can make it super easy to perform routine system checks.
The Diagnostic application was first introduced on Chrome OS 90 in April 2020. This can be considered a major upgrade over the previous system check method, which required users to visit the system page. The internals are quite complicated. In addition, Diagnostic comes with a series of useful tests that you can use to ensure all system features are working smoothly.
How to open the Diagnostic . application
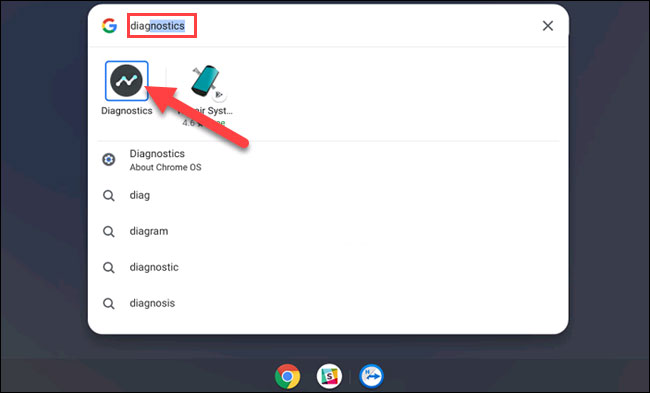
You won’t find Diagnostic in the launcher’s app drawer as usual. However, there are two other ways for you to launch this application. First, click on the launcher icon (with a circle) on the taskbar.

Click the search box and enter the keyword “Diagnostic”. Click on the “Diagnostic” application when it appears in the corresponding search results.
For the second method, you will open Diagnostic from Chrome OS Settings. First, click the clock icon on the taskbar to bring up the Quick Settings panel. Then, click the gear icon to open the Settings menu.
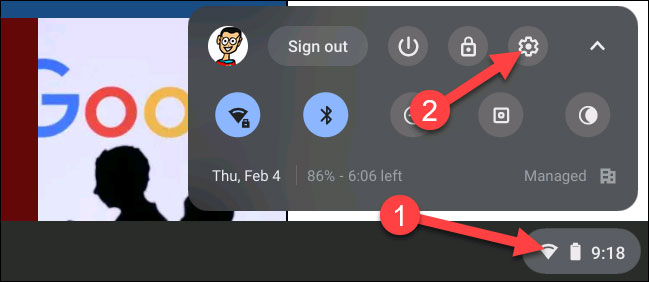
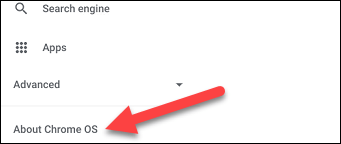
Next, click on “About Chrome OS” in the left sidebar.
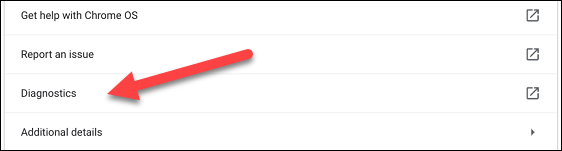
Now, click “Diagnostics” to launch the application.
Using Diagnostic
Basically, the Diagnostics application is divided into 3 parts: Battery, CPU and Memory. Each section will provide the user with an overview of the relevant information, as well as a message to perform the necessary checks. As follows.
The “Battery” section will show your device’s battery capacity and show how long you have left at your current battery level. Below that are three different metrics:
- Battery Health: The capacity of the battery may decrease over time. This number tells you how “healthy” or “healthy” the battery is. The higher the number, the better your battery is.
- Cycle Count: The number of times your Chromebook has gone through a full charge cycle — from 0-100%.
- Current: The amount of current the Chromebook is currently charging or discharging.
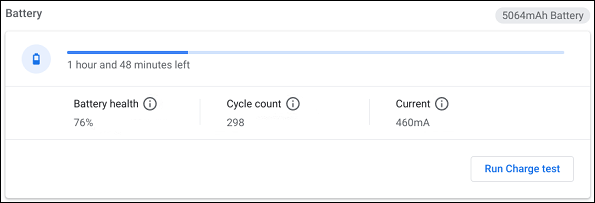
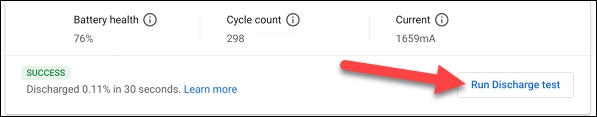
You’ll also see an “Run Discharge Test” or “Run Charge Test” option, depending on whether your Chromebook is plugged in or not. These test procedures will measure the charging or discharging rate of the device.
Next is the “CPU” section. Your device’s processor information will be displayed at the top, and you can also see a real-time graph of CPU usage below. There are three metrics here:
- Current Usage: The aggregate percentage of CPU level currently being used.
- Temperature: The current temperature of the CPU.
- Current Speed: The current speed of the CPU.
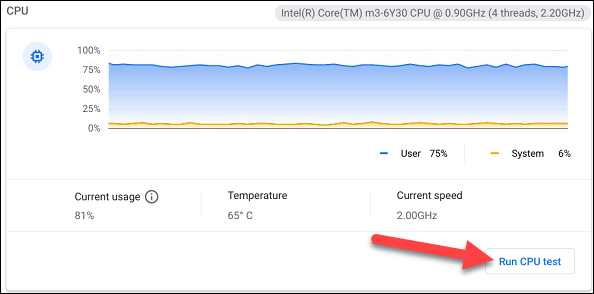
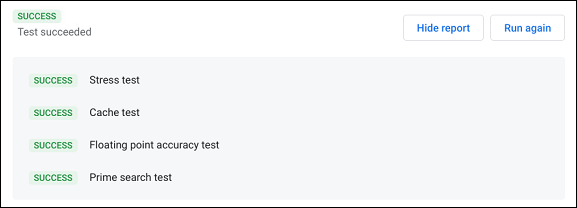
For more information, click “Run CPU Test”. Several tests will be performed to ensure that the CPU is working properly.
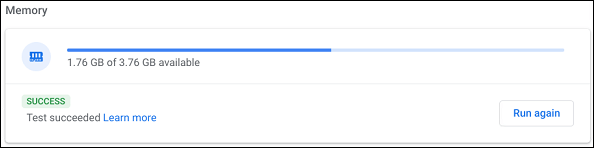
The last part is “Memory”. The blue progress bar shows the amount of available memory (RAM) in real time. You can click “Run Memory Test” for some more detailed information. This test will take about 15 minutes.
At the bottom of the page, you can click the “Save Session Log” button to read all the test data you have performed.

Source link: How to use the Diagnostic app on a Chromebook
– https://techtipsnreview.com/