We are done with 2 out of 3 parts of the comprehensive guide to Windows Task Manager. In today’s post, GhienCongListen will join you for part 3 – also the last part of the series of comprehensive manuals about Windows Task Manager. In this last part, we will learn about the last 2 tabs Details and Service.
The Complete Guide to Windows Task Manager (Part 3)
Detailed management of processes (Details tab)
This is the most detailed tab of Task Manager. It is like the Processes tab but provides a lot of detailed information and shows the processes from all user accounts in your system. If you’ve used Task Manager on Windows 7 already, you’ll be familiar with this tab; it’s like the Processes tab of Windows 7.
Advertisement
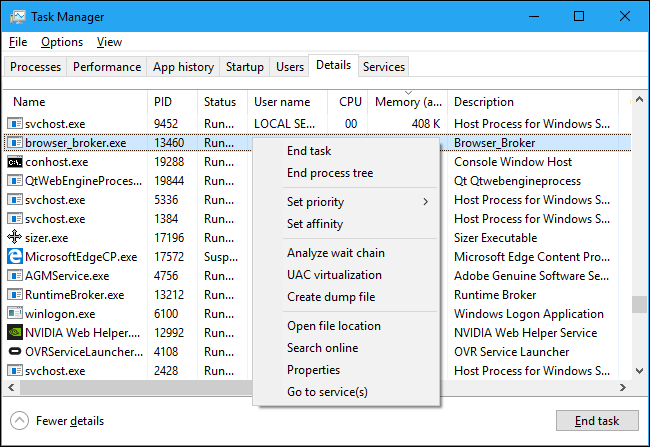
You can right-click on any process to open the following options:
- End Task: End the process. This option has the same effect as in the Processes tab.
- End Process Tree: Terminate the process, and all processes created by it.
- Set priority: Set process priority: Low, Below Normal, Normal, Above Normal, High, and Realtime. Processes when started will be set to normal. With software running in the background should have lower priority, and processes operating on the computer screen should have higher priority. However, Microsoft recommends not to touch the Realtime priority.
- Set affinity: Allocate processor cores to a given process – in other words specifying which processes run on which cores. By default, processes will run on all processor cores in the system.
- Analyze wait chain: Helps you determine why the app is not responding. This feature shows which process is waiting to use a resource that is being used by another process.
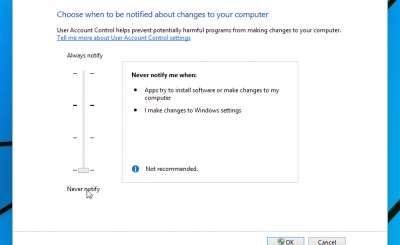
- UAC virtualization: Enable or disable user account control (UAC) for a certain process. This is a Windows security feature that helps prevent unauthorized changes to the operating system.
- Create dump file: Take a screenshot of the software’s memory and save it to disk. This is a useful debugging tool for developers.
- Open file location: Open the .exe file location of the process.
- Search online: Find the process name using Bing search engine.
- Properties: Open the properties window of the .exe file of the process.
- Go to service(s): Display the services associated with the process in the Services tab. Especially useful with processes svchost.exe.
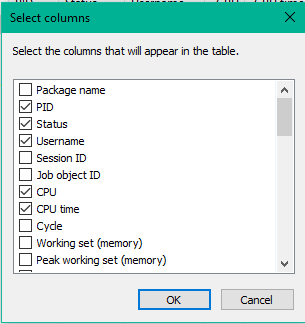
If you right-click on any column header and select “Select Columns”, you will see a longer list of other options available to you:
Advertisement
- Package name: For UWP applications, this will show the names of the application packages containing the processes. For other applications, this column will be left blank. UWP apps are usually distributed through the Microsoft Store.
- PID: A unique ID number assigned to a process. This number is associated with a process, not software, so if you disable and re-enable some software, the new process of that software will carry a new ID number.
- Status: Displays a running or suspended process to save energy. Windows 10 will always hang UWP apps if you’re not using them to save system resources.
- Username: The name of the user account running the process. You will see the system account name here as SYSTEM and LOCAL SERVICE.
- Session ID: Displays the unique ID number associated with the session running the process.
- Job object ID: Has the effect of grouping processes into a group so that they can be managed in different groups.
- CPU: Percentage of CPU resources being used out of total CPUs. If no software is using CPU time, Windows will write that the System Idle Process is using it. In other words, if the System Idle Process is using 90% of CPU resources, it means that all other processes in the system are using 10%, and the remaining 90% are idle.
- CPU time: Total processor time (in seconds) used by the process since it started. If you close and restart the process, this time will be reset.
- Cycles: Percentage of CPU cycles used by processes out of total CPUs. Microsoft does not explain the difference between this column and the CPU column, but it is essentially the same metric information but measured differently.
- Working set (memory): The amount of physical memory being used by the process.
- Peak working set (memory): The maximum amount of physical memory used by the process.
- Memory (active private working set): The amount of physical memory used by only one process. This column does not show data from suspended UWP processes.
- Memory (private working set): The amount of physical memory used by only one process. This column shows data from suspended UWP processes.
- Memory (shared working set): The amount of physical memory available to a process that can be used by other processes as needed.
- Commit size: The amount of virtual memory that Windows reserves for the process.
- Paged pool: The total amount of Page File (virtual memory) used by core Windows components.
- NP pools: Total amount of RAM used by core Windows components.
- Page faults: Displays the number of page faults generated by the process since it was started. This error occurs when a program tries to access data in an undefined page.
- PF Delta: Change in page faults since last refresh.
- Base priority: Process priority, for example Low, Normal or High.
- Handles: This is a value used to uniquely identify a resource, such as a file or a Registry key, in order for a program to access it.
- Threads: Is an internal object of the process. It runs program instructions that allow concurrent execution of operations within a process.
- User objects: The number of Windows management objects used by the process. Includes: windows, menus and pointers.
- GDI objects: The number of Graphics Device Interface objects used by the process. Used to draw user interfaces.
- I/O reads: Number of reads performed by the process since startup. I/O stands for Input/Output. This includes files, networks, and input/output devices.
- I/O writes: The number of write tasks performed by the process since startup.
- Other I/O: The number of tasks other than read or write performed by the process since it was started. Examples are control functions.
- I/O read bytes: The total number of bytes read by the process since startup.
- I/O write bytes: The total number of bytes written by the process since startup.
- I/O other bytes: The total number of bytes used for operations other than reading or writing since the process was started.
- Imagine path name: The full path of the .exe file of the process
- Command line: The exact command line is started with the process, including the .exe file and any command line variables.
- Operation system context: Minimum operating system compatible with the software.
- Platforms: Shows this as a 32-bit or 64-bit process.
- Elevated: To see if the running process needs Administrator privileges. You will see “Yes” or “No” at each process.
- UAC virtualization: Shows whether UAC virtualization is enabled for the process. This feature virtualizes software access to the registry and file system, allowing software designed for earlier versions of Windows to work without Administrator rights. Options include Enabled, Disabled and Not Allowed for processes that require system access.
- Description: Description of the process from the .exe file. For example, chrome.exe descriptive name is “Google Chrome“, and explorer.exe name is, has a name which is “Windows Explorer“.
- Data execution prevention: Displays whether Data Execution Prevention (DEP) is enabled.
- Enterprise context: Shows the business context of a running application.
- Power throttling: Shows whether Power throttling is enabled. This feature limits background apps that drain your device’s battery, in order to prolong battery life.
- GPUs: The percentage of GPU resources used by the process.
- GPU engine: The GPU engine is being used by the process, in other words which GPU engine is being used the most by the process. View GPU information in the Performance tab to find a list of GPUs and their engines.
- Dedicated GPU memory: The total amount of GPU memory being used by the process across all GPUs. GPUs have separate graphics memory installed in each GPU.
- Shared GPU memory: The total amount of system memory shared with the GPU being used by the process. This is the data stored in the system’s RAM shared with the GPU, not the data stored in the GPU’s separate memory.
See more:
Learn about the Services tab
The Services tab displays a list of system services on your Windows operating system. They are tasks that run in the background even when no user account is logged in. They are managed by the Windows operating system. Depending on each service, they can run automatically when the computer starts or only when needed.
Advertisement
Many services are part of the Windows 10 system always. For example, the Windows Update service is responsible for downloading the update, while the Windows Audio service is responsible for the audio. Other tasks are installed by 3rd party software. For example, NVIDIA services belong to the graphics driver.
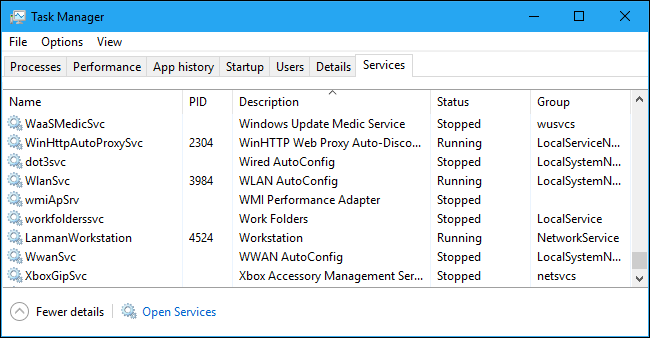
You shouldn’t mess around with these services unless you know what you’re doing. However, if you right click on them you will see options like Start, Stop or Restart that service. You can also select Search Online to perform a search for information about that service via Bing, or select “Go to details” to display the processes associated with the running service in the Details tab. Many services will have the “svchost.exe” process associated with them.
In the Services tab there will be columns as follows:
- Name: Short name of the service.
- PID: The ID number of the process associated with the service.
- Description: Longer names provide more information about the service.
- Status: Show the service status as “Stopped” or “Running”
- Group: Show task groups, if available. When starting the machine, Windows will load each service group one by one. A service group means a set of similar services grouped together.
To find out more information about these services, click the link “Open Services” below the list.
So we’ve gone through the third and final part of GhienCongList’s comprehensive guide to Windows Task Manager. Hopefully this series of articles has helped you better understand the Windows Task Manager tool – a tool that is extremely popular with users of this operating system. If you have any questions or suggestions, please leave a comment below!
According to howtogeek.com
Source: The Complete Guide to Windows Task Manager (part 3)
– TechtipsnReview


