In the previous post, GhienCongListen sent you the complete manual about Windows Task Manager Part 1. We talked briefly about the function of each type of tab in Task Manager and learned about the Processes tab, which is also the most popular tab for ordinary users. In this part 2, we will learn about tabs Performance, App History, Startup and Users Please!
The Complete Guide to Windows Task Manager (Part 2)
View performance information (Performance)
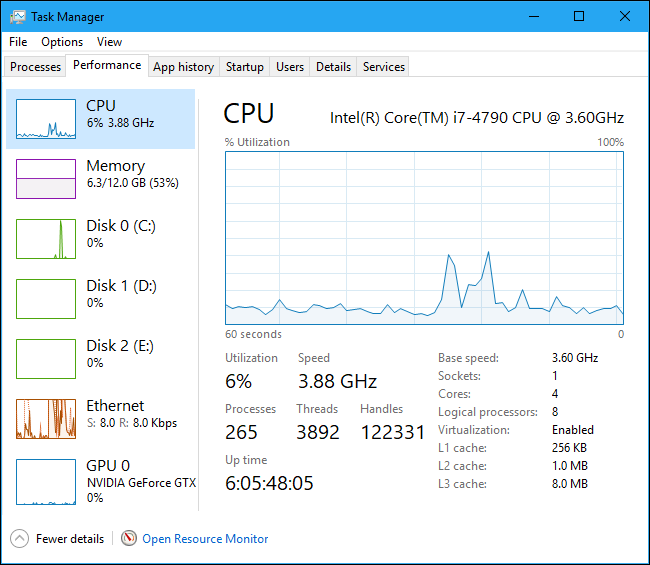 The Performance tab provides real-time graphs showing the usage of system resources such as CPU, memory, disk, network, and GPU. If you have multiple drives, network devices, or GPUs, they will be displayed separately.
Advertisement
You will see small charts on the left hand side, click on each to see a larger chart on the right hand side. This graph shows resource usage over the last 60 seconds.
See more:
Advertisement
In addition, the Performance tab also shows system hardware information:
- CPU: Displays the name and number of your CPU, its speed and multiplier. It also displays your system’s “uptime” time, which is how long your machine has been running since it was turned on.
- Memory: Shows how much RAM you have, its speed, and how many RAM slots are in use. You can also view the amount of memory filled by buffer data. This data will be available if your system needs it, but Windows will automatically clear the cache data and free up memory if the system needs more memory to run another task.
- Disks: The name and number of your drive, and the size and current read and write speeds.
- Wi-Fi or Ethernet: Windows will display the name and IP address of the network adapter.
- GPUs: Show different graphs for different types of activities. For example, 3D with video encoding or decoding. GPU has its own memory, so it also represents GPU memory usage. You can also see the name and model of your GPU and its driver version here.
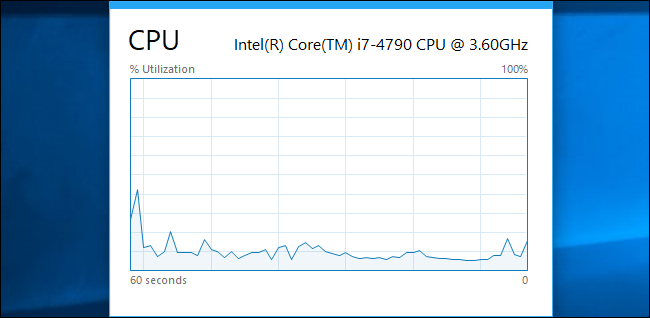
You can also minimize the Performance tab window if you want it to be visible all the time on your computer screen. Just double-click anywhere in the right panel, and the Performance tab will be minimized to a window that is always above the other windows. You can also right click on the chart and select “Graph Summary View” to enable this mode.
Advertisement
Knot “Open Resource Monitor” at the bottom is used to open the Resource Monitor tool, which provides more detailed information about the GPU, memory, disk and network usage of each individual process.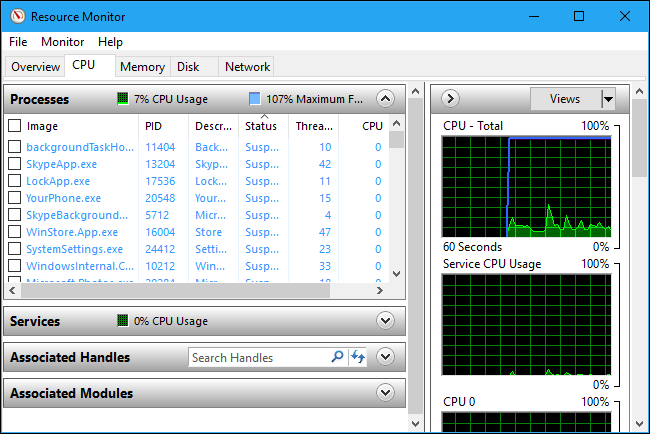
App History Survey
Tab App History only applies to Universal Windows Platform (UWP) applications. It does not display information about common Windows desktop applications, so it is not too useful for many people.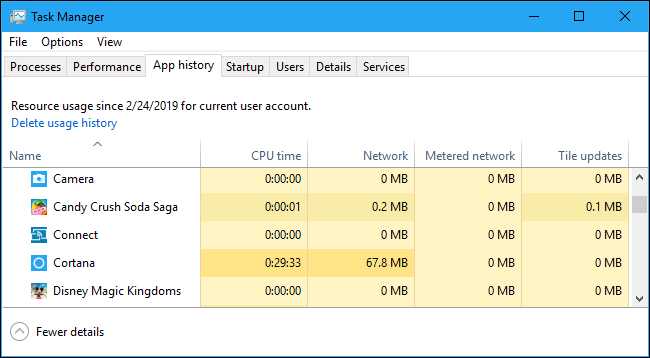
At the top of the window, you’ll see the date Windows started collecting resource usage data. This list shows UWP apps and the time or dynamics of CPU and network used by apps since that date. You can right-click on the title to activate a few more options to better understand network activity:
- CPU Time: The amount of CPU time the program used during this time frame.
- Network: The total amount of data transferred over the network by the software during this time frame.
- Metered Network: The total amount of data transferred over the Metered Network. You can set the metered network to be able to store data on it. This option is for network connections with limited capacity, such as telephone networks.
- Tile Updates: The amount of data that the software has downloaded to display the live tile has been updated on the Start Menu of Windows 10.
- Non-metered Network: The amount of data transferred over a non-metered network.
- Downloads: Amount of data downloaded by the software.
- Uploads: Amount of data uploaded by the software.
Manage Startup software (Automatically start when the computer is turned on)
The Startup tab is a tool to manage the startup software (software that automatically runs when the computer is turned on) of Windows 10. It lists all the software that automatically run when you log in to the user account.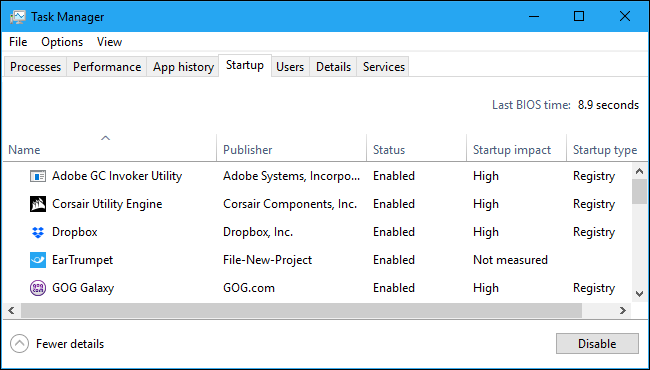
To disable a startup software, right click on it and select Disable or click the Disable button located at the bottom of the list. To re-enable, press the Enable button. You can also use Settings > Apps > Startup Interface to manage startup software.
On the right corner of the window, you will see the line “Last BIOS time” on some systems. It will show the amount of time it took for your BIOS to hardware boot during the most recent PC boot.
Like other tabs, you can also right-click on any column header to add more columns:
- Name: Show the name of the software
- Publisher: Software publisher name.
- Status: If any software is allowed to start automatically when the computer is turned on, it will be recorded as “Enabled“. And if disabled, it will write “Disabled“.
- Startup Impact: Estimate the CPU and disk resource usage of the software. Light software will display as “Low“And heavy software is”High“. The software has been disabled, it will say “None“. You can speed up your computer’s startup by disabling “High” software instead of “Low” software.
- StartupType: Show startup type due to “Registry” or do is located in the startup folder (“Startup“).
- Disk I/O at Startup: Measures the performance of the software on the drive when it is started, displayed in MB. Windows measure and save
- CPU at Startup: CPU time spent for a software to start when the machine is turned on, displayed as ms.
- Running Now: If a startup software is running, it will say “Running” here. If the box is empty, it means the software is disabled.
- Disabled Time: If you have disabled a startup software, the date and time when you disabled it will be recorded here.
- Command Line: This column displays the full path of the startup software.
Test users (Users)
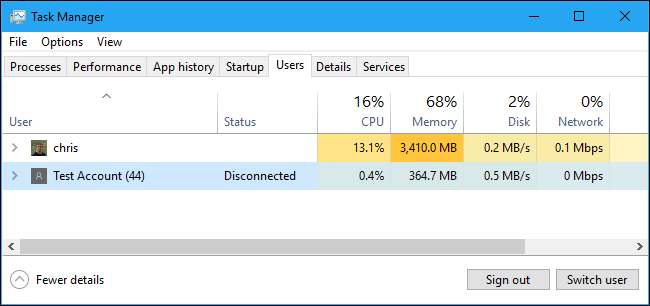 The Users tab displays a list of users logged on to the machine and their running processes. If you are the only account logged into the computer, it will only show your account. If another user is logged in and locked their session but hasn’t logged out, it will say “Disconnected” here. This tab will also show the amount of CPU, memory, disk, network, and other system resources used by the software running under each different Windows user account.
You can disconnect an account by right-clicking and selecting “Disconnect” or log out by right-clicking and selecting “Sign Off”. The “Disconnect” option will disconnect the account from the computer, but the software is still running and the user can log back in to continue using it. And “Sign Off” will turn off all processes, like outputting from the computer.
Here you can also manage the progress of other user accounts.
If you right click on any column header, you will see the following column types:
- ID: Each account that is logged in will have its own ID number. Number “0” to refer to system services. You do not need to pay attention to these numbers, so by default this column will be hidden.
- Sessions: Displays the session type. If it says “Console” then it is accessing your internal system. This feature is mainly used for remote computer control server systems.
- Client Name: If you are controlling the remote computer, the system name of the client accessing the machine will be displayed here.
- Status: The status of the session. For example, if a user locked their session, it would say “Disconnected“.
- CPU: Total amount of CPU being used by user processes.
- Memory: Total amount of memory being used by user processes.
- Disks: All work on the user process’s drive.
- Network: All network activity of user processes.
So we have finished part 2 of GhienCongList’s comprehensive guide to Windows Task Manager, please look forward to our next parts. If you have any questions or suggestions, please leave a comment for GhienCongListen to know!
According to howtogeek.com
Source: The Complete Guide to Windows Task Manager (part 2)
– TechtipsnReview

